Visual Sales Data (BM-144)
Visual is Easier
Visual representation of sales data provides an easier way to absorb information.
Here are some examples of its applications;
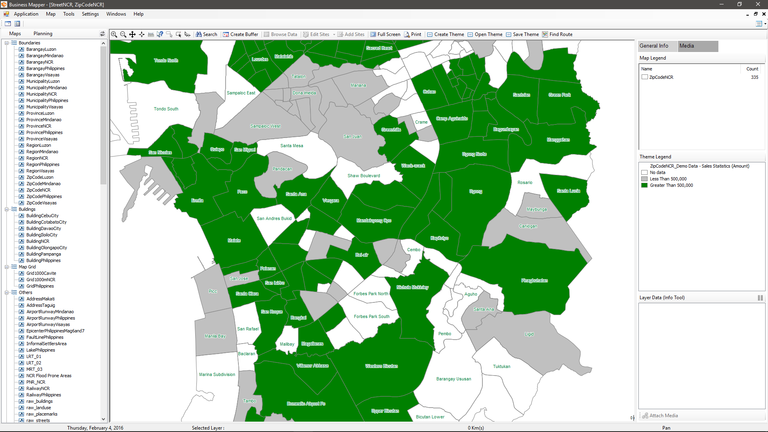
Find out where it matters
This theme represents sales with a threshold of PHP 500,000. Greens are equal or greater than, grays are less than, whites represents no sales at all.
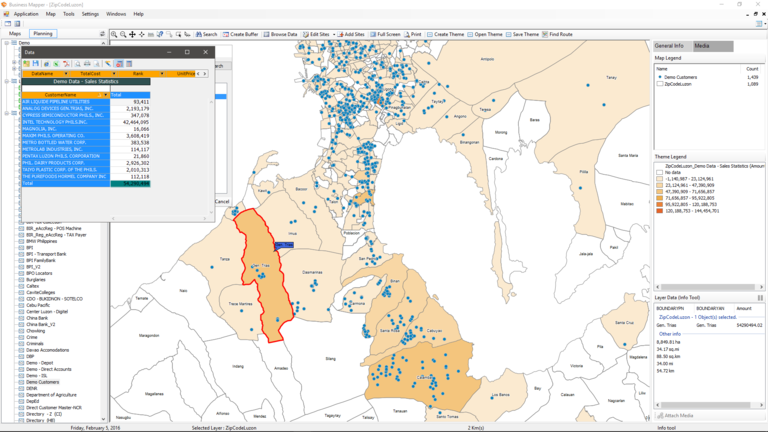
Sales and Customer Overlays and Drill-Downs
This theme represents sales figures in ranges. The darker the color, the higher the number.
Business Mapper comes with a selection tool, enabling users to drill down on an area of interest. The drill-down will extract data associated with a location.
The blue dots represent actual customer locations.
Business Mapper Team