Live Connect; A geo tagging app for area managers & sales reps to connect with their customers (Ref: BM-127)
Paperless Trail Inc. are extremely excited to announce the recently developed Live Connect android application. Live connect is the ideal tool for account audits, mapping, and customer profiling.
Why you need Customer Profiling:
- Allows businesses to see and understand how customers are distributed. (Utilize coordinates, location based information and timestamps).
- See the age of the information being reviewed and analyzed to ensure you are always up to date.
Existing sales force and reps can be fully utilized for essential field data gathering:
- Real-time data to be sent back to the Business Mapper server. (Customer Contacts, Industry Classification, Customer data etc)
- Real-time photos of your customers stores and competition (Storefronts, street pictures, potential new site locations etc)
This data can then be sent and relayed to the area managers, who in turn can relay the data to upper management. With this information, the submitted reports and surveys are used to plan, strategize and implement new business opportunities.
Visual information collected by reps can help manage and identify:
- Potential new site locations for distribution centers, hubs, and stores.
- Where to concentrate on new account development.
- Where the competition is, why it’s there, and effective methods to take a percentage of their customers to have a competitive edge.
- Where the saturated areas are in a given area radius or location.
- Where the untapped areas are in a given area radius or location.
- Where to execute outbound marketing campaigns.
- Where to place advertising. (Billboards, posters, advertising vehicles and personnel etc)
Each survey is submitted with a timestamp, GPS coordinates, and pictures taken during the survey.
Customer Profiling, Saturation, & site location planning
Customer profiling is an extremely effective method of measuring saturation. Each customer location is mapped out and compared against a universe of potential customers.
- Example: In the case below, the red highlighted POIs are the number of Generics Pharmacies within a given area. They have been plotted by a generics pharmacy rep using live connect. As you can see, the Distribution gaps are immediately clear, just by pure density alone.
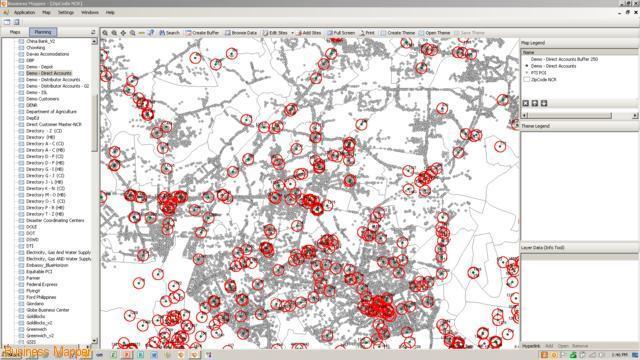
With the information given above, you can see:
- The number of Generics Pharmacies within the selected area.
- The spacing of Generics Pharmacies within the selected area to work out customer reach.
- Where the market is saturated for Generics Pharmacies in the selected area.
- Potential site locations where there is a large population density, but very few or no Generic Pharmacies in the area.
- The most densely populated areas, where having market saturation and full customer exposure is crucial.
Combining Data:
The area locations of a competing pharmacy business could be selected and displayed using a different color buffer, (i.e blue). You could then check this data alongside your own Generics Pharmacy outlets data to monitor and analyze your competition. This information can then be use to plan, strategize and implement business decisions.
Note: If this article leads to you making an inquiry to us, please use reference RE: BM-127 when you email us with your inquiry.